

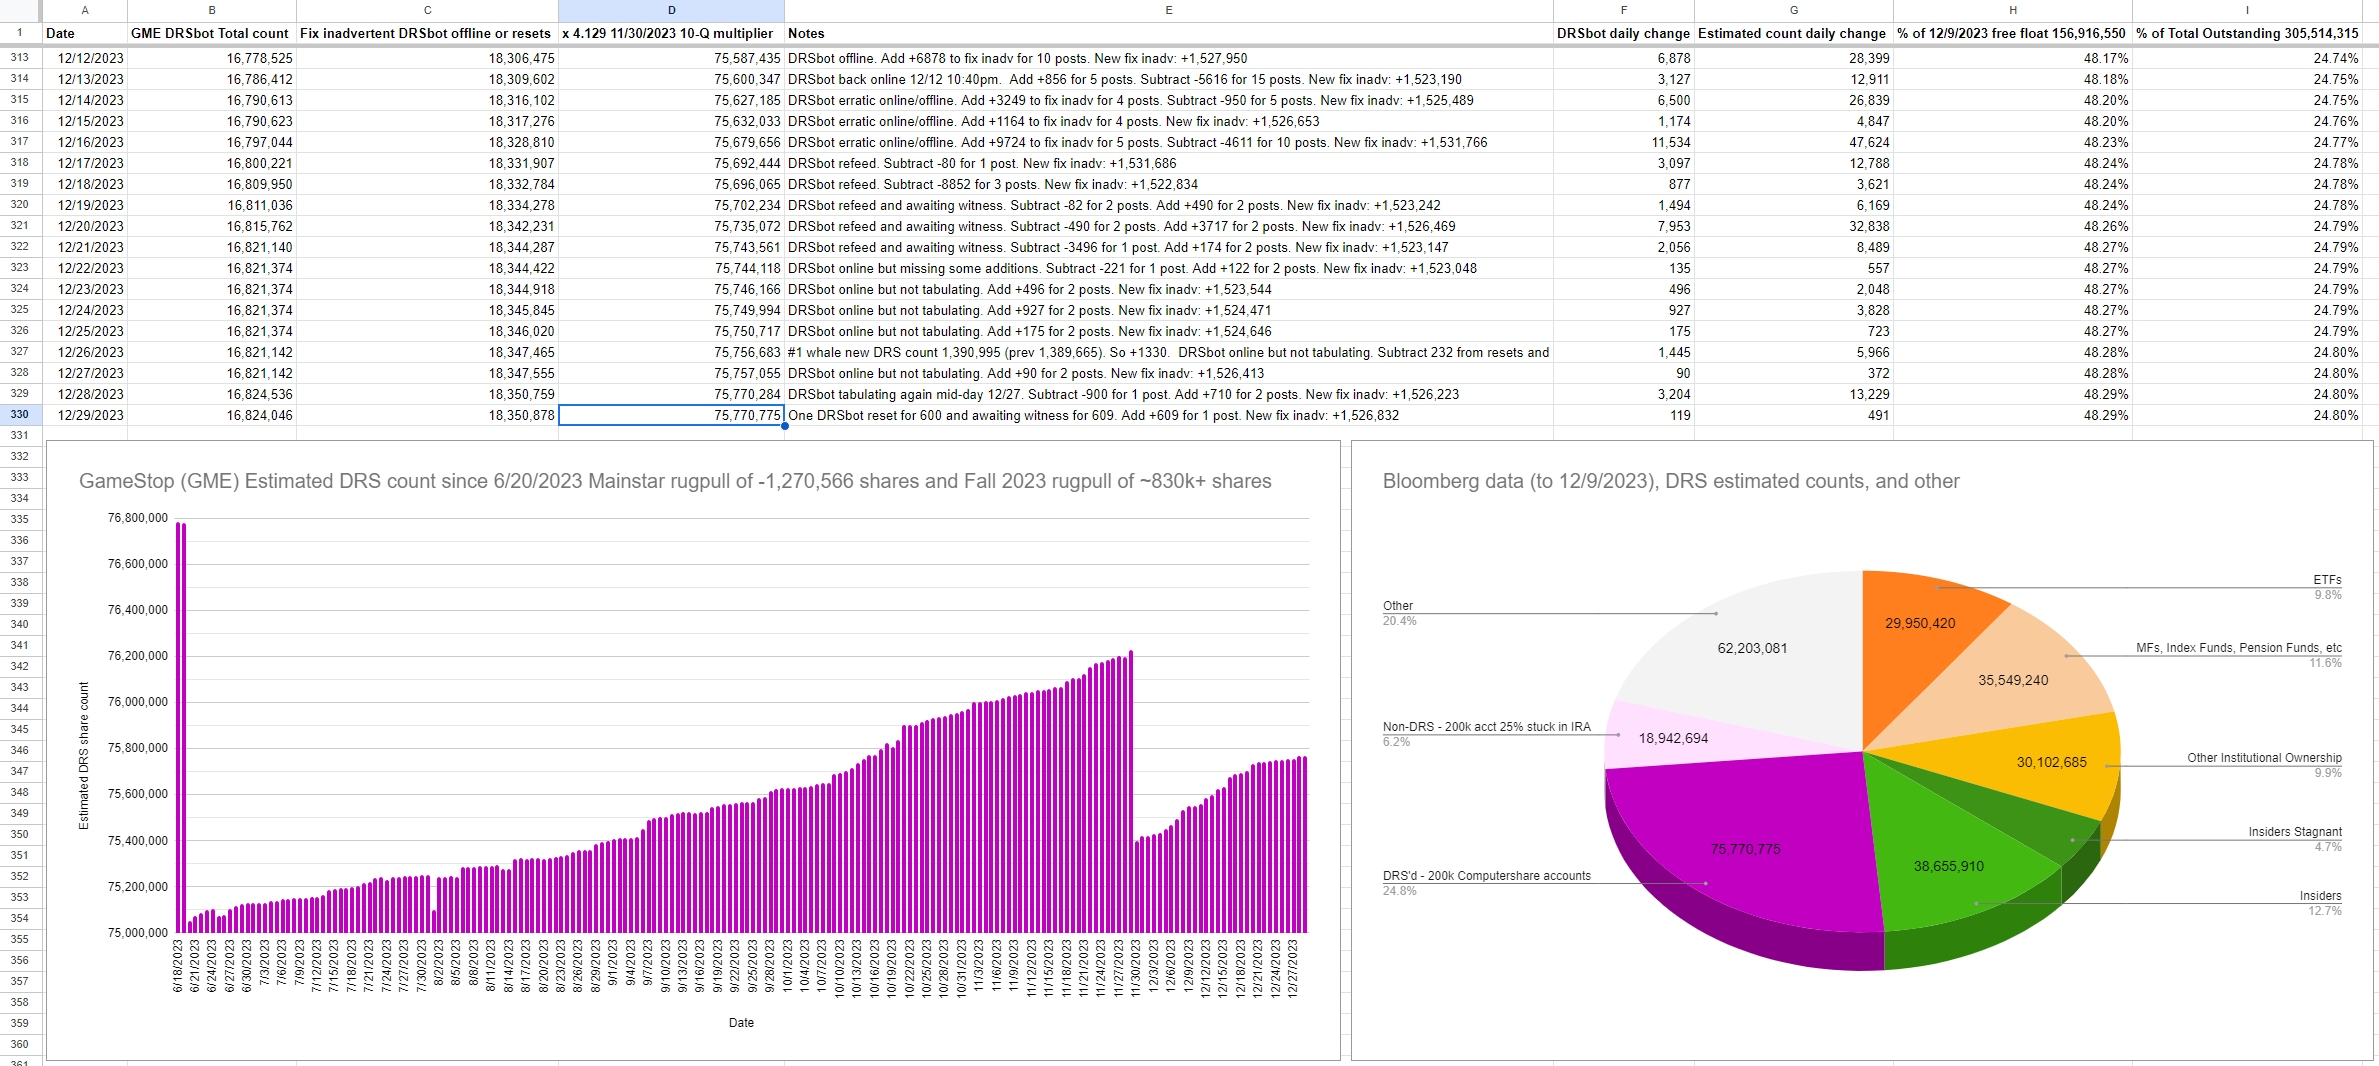
12/29/2023 Estimated DRS count: 75,770,775 ((using today’s DRSbot total + fix inadvertent DRSbot offline or resets) x 4.129)
The 4.129 multiplier comes from 11/30/2023 Form 10-Q divided by DRSbot 11/30/2023 total: 75,400,000 / 18,262,331 = 4.129
Bloomberg data (to 12/9/2023), DRS estimated counts, and other:
| Holding | Number of shares | As of |
|---|---|---|
| ETFs | 29,950,420 | 12/9/2023 |
| MFs, Index Funds, Pension Funds, etc | 35,549,240 | 12/9/2023 |
| Other Institutional Ownership | 30,102,685 | 12/9/2023 |
| Insiders Stagnant | 14,339,510 | 12/9/2023 |
| Insiders | 38,655,910 | 12/9/2023 |
| DRS’d - 200k Computershare accounts | 75,770,775 | 12/29/2023 |
| Non-DRS - 200k acct 25% stuck in IRA | 18,942,694 | 12/29/2023 |
| Other | 62,203,081 | 12/29/2023 |
- Total Outstanding on 11/30/2023: 305,514,315
- Thank you to lawsondt for the Bloomberg data to 12/9/2023
- “Non-DRS - 200k acct 25% stuck in IRA” is a conservative percentage. The Google share count surveys have suggested the 200k Computershare accounts have 30-40% additional shares stuck in IRAs.
- “Fix inadvertent DRSbot offline or resets” is primarily whale #1’s 1,390,995 DRS shares (as of 12/25/2023). Long story of switching subs and losing her DRS share count. So added the “fix inadvertent” column to capture her DRS shares.
Discussion points:
- It seems odd on some of the DRS count fluctuations since the beginning.
- There have been 2 “somewhat hidden” 2022 rugpulls (May 2022 and Aug/Sep/Oct 2022), the June 2023 Mainstar rugpull, and now the Sep/Oct/Nov 2023 rugpull.
- It seems odd on recent DRS count stagnating (excluding the Mainstar rugpull of 1.27 million shares). From a very simplistic view assuming 200,000 Computershare accounts:
| Buy X number of shares a month | Multiply by 3 months per quarter | Total DRS per quarter if 100,000 active accounts | Total DRS per quarter if 200,000 active accounts |
|---|---|---|---|
| 1 | 3 | 300,000 | 600,000 |
| 2 | 6 | 600,000 | 1,200,000 |
| 3 | 9 | 900,000 | 1,800,000 |
| 4 | 12 | 1,200,000 | 2,400,000 |
| 5 | 15 | 1,500,000 | 3,000,000 |
- The April 2023 list of stockholders DRS numbers seem correct and line up with SEC filings.
- Possible some investors have had to un-DRS.
- Possible economic slowdown and inflation have reduced investor purchasing power.
- Possible whale investors who helped inflate DRS numbers alot, have dramatically slowed down their purchasing.
- Tinfoil - certain parties inflate DRS shares 9 to 18 months back, then drain their DRS shares later. Probably spread across say 3,000 accounts to make it seem like normal activity.
- Tinfoil - operational efficiency draining from DRS non-Book shares on certain dates.
- Tinfoil - possible something funny with SEC filing reported number.
- There is the recent post from sister sub, google search on: Deep analysis on Computershare recurring buys reddit
He examines the bi-weekly recurring Computershare buys. The bi-weekly recurring buys were around $900k to $1.5 million.
An alternative DRS count estimation may be estimating money spent by retail purchasing GME per quarter. It was around $1.2 million average per 6 recurring Computershare buys per quarter. Then say a massively conservative $200k per other trading day. So:
If average $1.2 million spent per bi-weekly purchase, and say $14 a share, multiply by 6 for one GME quarter:
- 1,200,000 / 14 = 85,714 shares * 6 = 514,284 shares
- The 6 recurring buys alone should add 514,284 DRS shares.
Other 54 trading days:
- $200,000 / $14 a share = 14,285 shares a day
- 54 * 14,285 = 771,390 shares
Total:
514,284 + 771,390 = +1,285,674 DRS shares a quarter
You must log in or register to comment.